ProGRN_FJG1
Select a link below to view a subnetwork of the FJG1 GRN in a browser window.
ProGRN_FJG1_Subnetwork_1k
Top 1,000 network connections, determined by max differential expression between time points 24 h (oxic) and 48 h (hypoxic) experimental conditions. The smaller size of this network enables a search feature that is not possible with the larger networks. Also included on this page is an extended menu of customizable options.
ProGRN_FJG1_Subnetwork_10k
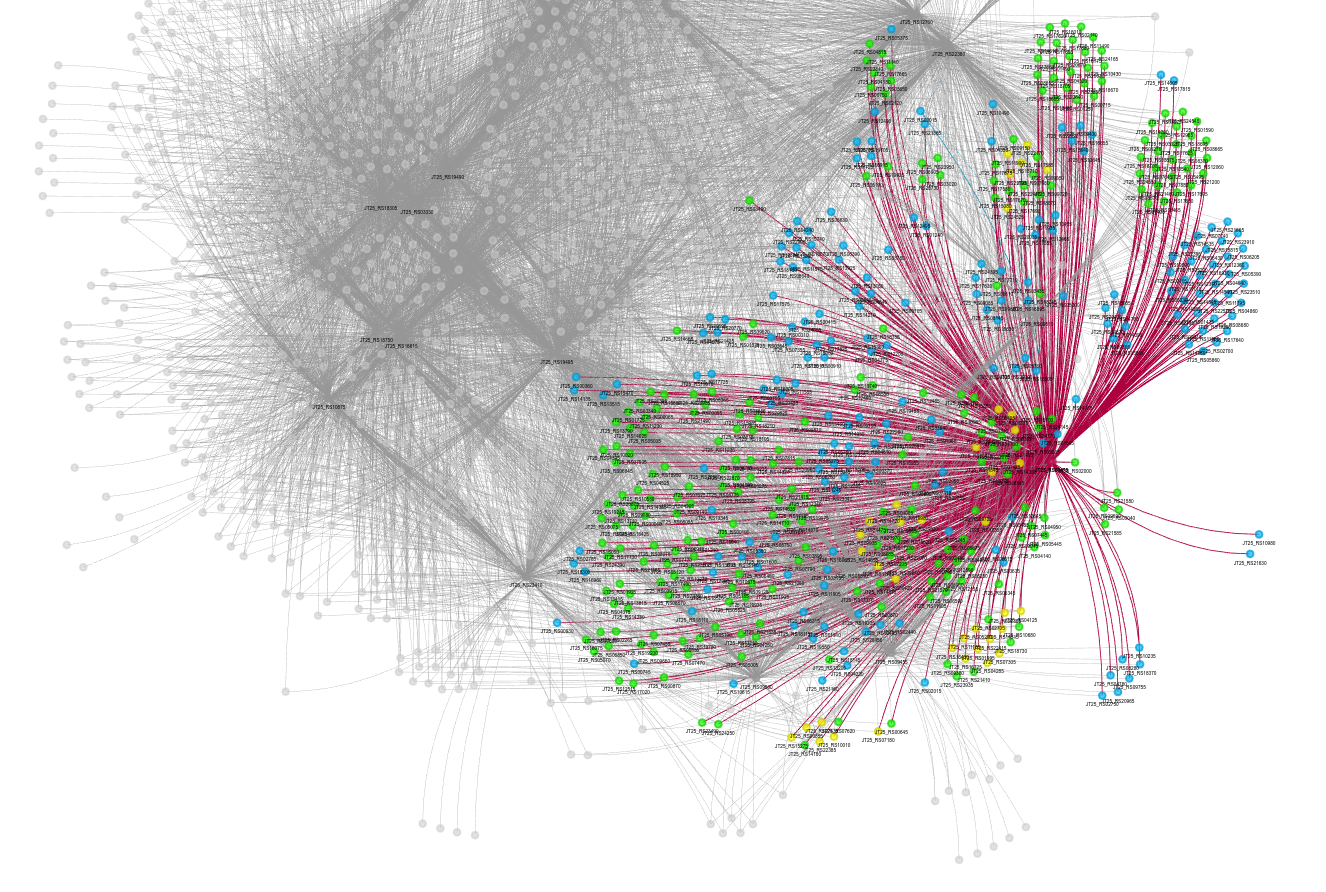
Top 10,000 network connections, determined by max differential expression between time points 24 h (oxic) and 48 h (hypoxic) experimental conditions.
Lines represent connections between regulator and target genes. Red circles denote regulator genes. Blue circles denote target genes linked under hypoxia with supplemental nitrate. Yellow circles denote target genes linked under hypoxia with supplemental ammonium. Green circles denote target genes with connections found under hypoxia in both nitrate and ammonium supplemented growth conditions. Nodes are labeled with the gene locus annotations from M. denitrificans FJG1 (GenBank ID CP014476).
In the visualization window
Hover over a gene node to see gene locus and functional information.
Click on a node to highlight subnetwork connections.
Click on a node and drag to reshape the visualization.
To stabilize the network view, uncheck the "enabled" box.
Experiment with the Physics settings to reorganize and customize the visualization.
CC-BY-NC-SA-4.0 2025 Cerrise Weiblen.
https://creativecommons.org/licenses/by-nc-sa/4.0/legalcode